Has The Compacted NBA Season Resulted In More Injuries?
May 1, 2012 - by Doug VanDerwerken
This is a guest post by Doug VanDerwerken, a PhD student in Statistics at Duke University and a lifelong basketball fan. If you’re interesting in writing a guest post, please email us at support@teamrankings.com.
A few months ago I wrote an article about the effects of the 2011 NBA lockout on league-wide injury rates. The tentative conclusion was that while injuries per week had increased due to the compacted schedule, injuries per game had not. I predicted that the number of injuries which would be incurred by the end of this season would be approximately equal to the number of injuries incurred by Game 66 in the previous two seasons.
In light of the tragic playoff injuries to young stars Derrick Rose and Iman Shumpert, the question of the lockout’s effect on injuries has again come to the forefront of basketball commentary.
Commissioner David Stern weighed in on this issue as recently as Monday, explaining that while it was certainly something to study in the off-season, he didn’t think the compressed season had increased the number of injuries. According to ESPN.com, Stern argued, “In most years we average about five [torn] ACLs [in the league], and prior to this year’s playoffs we had three.”
Do the numbers agree with him?
Injury Rates Held Steady
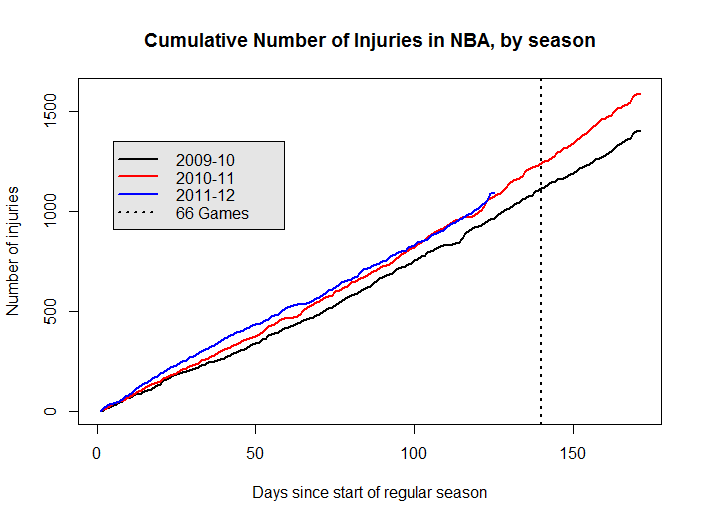
My newest analysis confirms Stern’s hunch. The linear trend which I had noticed at week six has continued through the whole season. If anything, the injury rate appeared to decrease relative to the rates from other years.
In the following plot, the blue line represents the cumulative injuries for the current season, and we see that it stops at about the same height that the 2009-10 and 2010-11 seasons reach by Game 66 (see dotted vertical line).
Thus the lockout has not increased the number of injuries incurred.
Quality vs. Quantity
However, it’s not quite satisfying to look only at the cumulative number of injuries. Perhaps the injuries haven’t become more frequent — they’ve just become more severe. Initial research suggests that this may in fact be the case.
Consider the following chart, which describes the probability of an injured person playing in his next game. [This includes playoffs (except for this year), so the numbers don’t quite match up with the above plot.]
| Probable | Questionable | Doubtful | Out | |
|---|---|---|---|---|
| 2009-10 | 960 (60%) | 443 (28%) | 93 (6%) | 108 (7%) |
| 2010-11 | 1068 (60%) | 480 (27%) | 115 (6%) | 110 (6%) |
| 2011-12 | 594 (51%) | 343 (30%) | 85 (7%) | 137 (12%) |
In the 2009-10 and 2010-11 seasons, we see a very clear pattern. Most injuries (60%) are not catastrophic and the player may well play in his next game. About half as many (27% or 28%) are listed as questionable, and the remaining 12-13% are split evenly between doubtful and definitely out. The χ2 test for independence suggested no real difference in this distribution between the 2009-10 and 2010-11 seasons (p-value = 0.771).
But something strange happens in the compressed season. The proportion of injured players listed as “probable” drops to 50%, and the number who are definitely out increases to 12%. This may seem like a small change, but it is strongly significant (p-value < 0.001), which means there is definitely a difference in the quality of injury.
Not So Fast
We’ve been pretending that how likely a person is to play is a good sign of how severe the injury is. This assumption, while reasonable, is probably not exactly valid.
For example, team doctors may at first believe an injury to be minor, and so the player is listed as probable, but after additional tests, it’s actually something much more serious. And though the data set may later be updated to reflect this, it is often done by adding a “new injury” which is more severe instead of replacing the first.
Similarly, it can be hard both in real life and in the recording of data to distinguish between a re-injury and the same injury. If a player tweaks his ankle Wednesday night and so is listed as “probable” for Friday, is it a new injury if on Friday he sprains the same ankle, causing him to miss the next three games?
Moreover, the data we had (and hence our whole analysis) considered only new injuries. The question that may be of real interest is whether the number of games (or better yet, minutes) missed due to injury has increased, a topic tackled by Kevin Pelton of BasketballProspectus.com. In an independent analysis, Pelton came to the same conclusion that I did — that there are no more injuries this season as compared with the previous two. (See, for example, this Pelton podcast.)
Conclusion
The take-home message is this: the compressed schedule did not result in more injuries. It does appear to have altered the nature of the injuries, however, but this is hard to extract precisely from the available data. I am a statistician, so of course I wish I had more data and cleaner data; but like the Chicago Bulls, I guess I’ll just have to make do with what I have.
Printed from TeamRankings.com - © 2005-2024 Team Rankings, LLC. All Rights Reserved.
