Predicting Circa Survivor Contest Pick Popularity for 2023
We go through some of the data from last year's contest and discuss how to predict pick rates in Circa Survivor 2023.
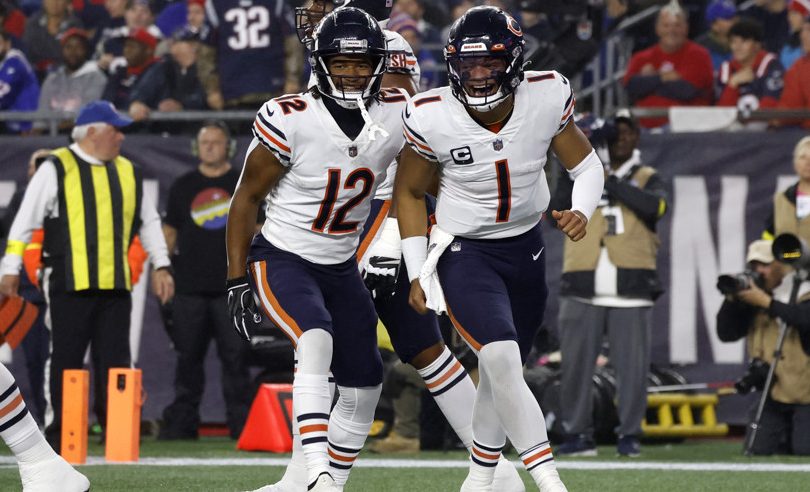
Justin Fields and the Bears knocked out a higher percentage in Circa last year than any other team.
The Circa Survivor Pro Football contest is back for 2023. It features a guaranteed prize pool of at least $8 million this year, up from $6 million a year ago. Contestants can enter up to 10 entries this year as well, at $1,000 per entry.
The contest also features several unique rules twists, most notably that the Thanksgiving and Christmas slates are their own pick week. Those make it one of the most challenging survivor pools around. Add in a very large pool size and large entry fee, and the picks in Circa can sometimes look quite different from other survivor pools. To get an edge, though, you have to make picks for this specific pool, and try to assess the value opportunities that arise.
We are going to go through last year’s pick results, and try to highlight some key factors in trying to project Circa weekly pick popularity for 2023.
Golf Pool Picks
Get an edge in your PGA Majors and One And Done pools
Circa Pick Rates Show Tendency Toward Sharper Picks
The biggest factor in Circa is a tendency for the overall pick popularity to skew toward sharper pick play. That’s not to say that there aren’t some clear examples of sub-optimal play. There certainly are when you have over 6,000 entries.
But when each entry costs you $1,000, it tends to weed out the volume of survivor players who are just casually putting in picks without much thought.
We are going to demonstrate this by going through different levels of picks, by public pick popularity, and how those same teams were handled in Circa last year.
We looked at the first 11 weeks of the season, and compared public pick rates from national data, to how the Circa contestants picked teams. (Week 11 was the final week before the Thanksgiving week twist in Circa, and also when the number of remaining contestants dropped under 100.)
We pulled all picks that had either public popularity of 1.5% or higher, or pick popularity in Circa of 1.5% or higher, during that span. That gave us an even 100 different picks.
Below, we are going to divide that into different types of picks and discuss them. We divided survivor picks into three different groups:
- Popular public picks: the 20 most popular picks by public data, at 18% or higher pick popularity
- Moderately popular public picks: 41 picks that ranged from between 5% and 17% public pick popularity
- Contrarian public picks: 39 picks with public pick popularity below 5%.
Using PoolGenius Data as a Proxy for Sharp Play
We are going to compare teams within each of those groups based on how we graded games last year.
We like to think we are fairly sharp at survivor pools, as our subscribers have reported winning at rates well above expectation in survivor pools for each of the last six seasons. Our recommendations on teams in a given week are driven by consideration of expected value, win odds, public pick popularity, and future value. We also have subscribers who play in lots of pools and play portfolios with lots of picks, and in different sizes and pool rules variations.
So we will use our recommendations as a proxy for sharp play decisions to show how you need to account for this in Circa.
We have our overall weekly final recommendations historically, and can see whether we were higher or lower than the public on a particular team pick. This next chart shows us how Circa’s pick rates compare to the public pick rates, depending on our position on a pick.
- PG Heavy: Our weekly pick recommendation rate was higher than 150% of the public rate
- PG Neutral: Our weekly pick recommendation rate was between 50% and 150% of the public pick rate.
- PG Fading: Our weekly pick recommendation rate was less than half the public pick rate.
For example, if a team had 30% public pick popularity from national data, they would be classified as “PG Heavy” if they were being recommended to 46% or more of our subscriber entries. It would be “PG Neutral” if our pick recommendations were between 15% and 45% of all subscriber entries. And it would be “PG Fading” if we were recommending that team to 14% or fewer subscriber entries that week.
The Most Popular Public Picks vs. Circa
Let’s start with the most important group in many pools, the popular picks.
There is a correlation between how the public in general picks, and how Circa contestants picked, though it was highly variable.
We saw some extreme swings relative to raw public pick data in the Circa Survivor contest in 2022. Of the 20 picks that had the highest public pick popularity nationally, six of them were at least +/-17% off from the public rate. The average “error” was +/-10%.
Here were the largest differences between the public and Circa pick rates:
- Buffalo, Week 5: 34% public pick rate, 11% in Circa
- New York Giants, Week 10: 35% public pick rate, 15% in Circa
- New England, Week 7: 26% public pick rate, 46% in Circa
- Dallas, Week 8: 31% public pick rate, 49% in Circa
- Baltimore, Week 11: 47% public pick rate, 29% in Circa
- LA Rams, Week 2: 28% public pick rate, 11% in Circa
Those are some big swings, that materially would have impacted Expected Value of those, and other picks, in those weeks. So let’s see how those swings break down once we account for sharp play patterns as represented by our recommendations.
| PG Position | Number | Public Rate | PG Rate | Circa Rate |
|---|---|---|---|---|
| PG Heavy | 4 | 24% | 43% | 37% |
| PG Neutral | 6 | 28% | 25% | 26% |
| PG Fading | 10 | 29% | 3% | 24% |
| Overall | 20 | 28% | 17% | 27% |
- The four popular picks we were most heavily recommending were all picked at least 10% higher in Circa than public averages;
- Only one of the remaining 16 popular picks saw a difference that high, relative to public pick popularity figures.
Moderately Popular Public Picks vs. Circa
If you weren’t on one of the most popular team in a given week, the chances are good you were taking one of the next alternatives. Our next group features teams with 5% or higher public pick popularity (but outside the top 20). Forty-one picks were part of this group, and generally represented those among the top 3-5 most popular picks in a typical week.
| PG Position | Number | Public Rate | PG Rate | Circa Rate |
|---|---|---|---|---|
| PG Heavy | 11 | 10% | 27% | 15% |
| PG Neutral | 6 | 9% | 10% | 7% |
| PG Fading | 24 | 10% | 1% | 8% |
| Overall | 41 | 10% | 9% | 10% |
- Of the 11 teams in this range where our recommendations were higher than public, all were picked at or above the public pick rate in Circa.
- On average, they were picked at a rate 1.5x higher than the public pick popularity number.
- 80% of the teams we were fading or neutral on were picked at a lower rate in Circa than the public pick popularity average.
Contrarian Public Picks vs. Circa
Finally, we will take a look at the contrarian-type plays, those survivor picks that were drawing some pick popularity (1.5% up to 4%) but not among the most popular choices in a typical pool.
For this one, we subdivided the “PG Heavy” category into two groups. The categories for teams with decent popularity were sufficient, but there’s a pretty big difference between a team we were recommending to 30% of our subscriber entries and one that we were recommending to 5%. But both would count as heavy for a team with 2% public popularity.
So “PG Heavy-1” are contrarian picks were we were recommending them to at least 15% of subscriber entries in a given week, and a bigger part of our survivor strategy for that week. “PG-Heavy-2” were those that qualified but were being recommended to under 15%, and are more properly classified as back-end-of-portfolio recommendations for subscribers playing multiple entries.
| PG Position | Number | Public Rate | PG Rate | Circa Rate |
|---|---|---|---|---|
| PG Heavy-1 | 9 | 3% | 27% | 8% |
| PG Heavy-2 | 8 | 3% | 8% | 4% |
| PG Neutral | 6 | 2% | 2% | 3% |
| PG Fading | 16 | 2% | 0% | 2% |
| Overall | 39 | 2% | 8% | 4% |
- All nine of the teams in the “PG Heavy-1” category were picked at a rate in Circa higher than the public pick popularity average.
- Four of those nine had pick popularity of 9% or higher in Circa, and only two were under 5% in the contest.
- One team in our “PG Heavy-2” group had a pick popularity at 9% or higher, and two others were above 5% in Circa.
- None of the 22 teams in the bottom two groups had a pick popularity in Circa above 5% (one was at exactly 5%).
Thanksgiving and Christmas Game Schedules Impact Circa Picks
The biggest rule twist in Circa is the holiday games feature. For 2023, this means that Week 12 (Thanksgiving) and Week 16 (Christmas) will be sub-divided into two different pick weeks each. As a result, contestants have to go 20-0 to make it all the way to the end of the season successfully.
These holiday rules impact the pick rates in Circa, making public pick data unreliable in weeks where a notable team who plays on Thanksgiving or Christmas is involved.
This could be particularly notable in 2023, as several of the top teams play on one of the holiday slates. Dallas is likely to be one of the biggest favorites on Thanksgiving. Kansas City and Philadelphia both play (separately) on Christmas Day, and San Francisco plays on both (at Seattle, vs. Baltimore).
Projected Holiday Favorites Tend to Get Saved
Over the last three years, we’ve seen in Circa that teams expected to be among the biggest favorites on a holiday game slate are largely saved. This results in some early weeks where the data is very different from the public survivor pool data.
Buffalo in Week 5 last year is the biggest example.
The Bills were nearly a two-touchdown favorite against Pittsburgh. The public pick rate was 34%. But Buffalo had a lot of future value anyway, and that was boosted even more because they played on Thanksgiving Day. So they were picked only 11% in Circa.
That big swing meant 23% that had to go somewhere. In this case, it pretty much all went to Jacksonville. The Jaguars were being picked publicly about 15% of the time, but that shot up to a massive 37% in Circa. The Jaguars lost that game to Houston. They were one of the exceptions where the Circa players went more heavily on a team our recommendations were fading. The holiday factor was almost certainly the reason why.
Two years ago, it was Arizona in Week 7 who was the most popular pick nationally, but had significantly lower pick rates in Circa, because they were also projected as one of the bigger favorites on Christmas Day.
So you should discount some of the teams that play on the holidays, and shift those picks elsewhere, especially if the team in question projects as one of the top two choices on the holiday schedule.
Past Circa-Specific Usage Matters
The Circa pick rates will also tend to diverge more from the public as the season goes on, due to to differences in team availability. Because the rules and pool behavior can alter some of the popular picks quite significantly, that introduces different pick dynamics down the road.
For example, Baltimore was even more popular in Circa (27%) in Week 1 compared to national data (20%). When over half of a normal pool was wiped out with last year’s Week 1 upsets, that meant that Baltimore was even more heavily represented among survivors going forward in Circa, compared to a typical pool.
As a result, when Baltimore had public pick popularity in Week 11 of 47%, that didn’t translate to Circa. The Ravens were picked by 29% of entries, and that’s because of availability compared to national averages.
Future Value Savings Opportunities Can Get Over-Picked
Finally, you will see some cases where the team you need to take to save future value gets over-picked, presenting a potential EV opportunity against them. With entries likely needing to go 20-0, you have to use lots of teams.
The biggest outlier last year in pick rate was probably caused by this phenomenon.
New England was picked by 46% of Circa entries against the Bears in Week 7, nearly double the public pick average. The public loved New England because “it was the week you had to use them” as they had low future value. Circa went even harder on the Patriots, and it was the highest percentage knock out all year in the contest.
Strategy Takeaways: Projecting the Circa Future
Now that we’ve covered some of the key drivers to Circa survivor pick rates, let’s close by talking about how you adapt to that.
The biggest key here is to project Circa pick rates using public pick data as a rough guideline, but moving your assumptions quite a bit in some cases based on factors like sharper play and holiday impact.
The worst thing you can do in Circa is think you are making the smart pick, only to join a bunch of other people on that same pick, greatly reducing the value.
Think About the Contrarian Position Values
Let’s take San Francisco in Week 2. In general public pick data, the 49ers were barely being picked (4%) despite being an 8.5-point favorite over Seattle. San Francisco had been upset in Chicago the previous week, while Seattle was coming off a win. There were four other teams favored by around 10 points in Week 2, so the 49ers were being ignored (or avoided after their previous loss) publicly.
But in Circa, San Francisco ended up being picked by 18% of all entries. That made them the second-most popular pick that week in the contest, largely eliminating the entire reason for taking them: they were unpopular but almost as safe as others.
We know that Circa pick rates tend toward sharper positions. That becomes most important when making contrarian picks, where you want to actually be contrarian to create the expected value. After all, most contrarian picks aren’t the biggest favorite of the week, but rather, a team with slightly riskier odds who is under-picked.
Use PoolGenius Tools and Data for Circa
It can be helpful to evaluate scenarios where the best “contrarian” picks are more popular by 5% or more, to see what impact that has on the value proposition. Sometimes, you are making that pick to save future value and a slight dip in EV is acceptable. Other times, you want to move to a second-order contrarian pick, or an actual popular pick that could be less so in Circa.
But you won’t know which direction is the right move for this sharper pool until you run the data.
Our advice would be to make adjustments to the public pick data accounting for the Circa factors, and re-run the EV calculations to identify picks. We have an EV Calculator tool where you can set your own pick popularity estimates and see how that impacts the EV numbers.
We cited our weekly recommendations above as a clear correlated indicator of sharper behavior that was predictive of Circa pick rates. If you are interested and want access to our data and pick recommendations, you can subscribe to our NFL Survivor Picks and get strategy discussion and pick analysis throughout the season.
Golf Pool Picks
Get an edge in your PGA Majors and One And Done pools